There are many ways to approach the analysis and reporting of data via Certainly functionalities. Here, we provide guidance on how to best utilize the Message Reports datasets.
Message Reports is a legacy feature. We recommend using the Message Insights Report for an overview of all visitor messages that lead to tagged Modules.
Tracking and analyzing the data users generate through the bot provides substantial insight into your bot's workings and performance. Also, it helps determine your bot's viability and interaction tendencies, as well as its strengths and potential for improvements.
In this article, we'll cover:
- Requesting the dataset
- Understanding the dataset
- Dataset and layout preparation
- Formulas and calculations
- Why Excel Pivot Table is your new best friend
- Visualization
The metrics you'll learn to calculate include the unique total or over time count of conversations, users, fallback, ticket creation, as well as recognition rate, and many more.
Requesting the dataset
The Message Reports section of the Certainly platform can be accessed via the Navigation bar. After you specify the bot and time period you wish to look into, you will see a newly added functionality called "Report Type". This filter allows you to choose one of our pre-made message report templates.
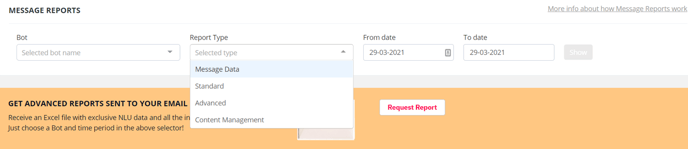
These report templates contain various columns and categorizations of data, depending on your needs. We currently offer:
- Message Data: includes (meta) data and details about every message sent and received by the bot
- Standard: gives an overview of the user's interaction with the bot and the flow of the conversation
- Advanced: provides the largest amount of information on conversation flow, message content, and bot label configuration
- Content Management: allows for detailed analysis of the bot's Module content
Once you decide upon the report type that best suits your analysis, click on the "Request Report" button, and the report will be sent to your e-mail in the form of an Excel workbook. Please note that in order to open the CSV file correctly, you will need to import it into Excel.
The other possibility is to download the CSV file directly from the page, but keep in mind that it will only account for a period of 15 days. Longer periods can only be accessed via e-mail.
For this article, we use the Advanced report template as an example for our analysis.
Understanding the dataset
Once you receive the dataset and open it in Excel, there will be an abundance of data you can work with.
The data entries recorded in rows start from the most recent and finish with the oldest entry in the range. These data entries reflect each interaction that occurred in a conversation. The columns represent the categories by which the specific data is placed and correspond to the column names and descriptions listed in the Message Reports article.
For now, we'll focus on the most general but fundamental categories of data that can paint an overall picture and give you a more definite sense of your bot's performance.
These are the categories we'll use as an example:
- Conversation / Message date & time
- Conversation / Module ID
- Conversation / Module name
- Conversation / Next bot module ID
- Conversation / Conversation ID
- User / Certainly User ID
Dataset and layout preparation
The simplest way to extract the mentioned columns is by copying and pasting them into a new worksheet or workbook. This way, you leave the original data source intact, allowing for the dataset's future usability.
Alongside the columns, it is advisable to create a map legend that will hold information on the key Modules you deem to be most important. It will help you keep track of the Modules, especially if there are multiple bots involved.
The best Modules to start with include the Starting Module, Fallback Module(s), Handover Module, Ticket Creation Module, etc. These Modules will most likely be the ones you usually track with Tags, so be sure to consider those as well.
| Module Legend | Module ID |
| User Question Module | 247844 |
| Fallback | 233571 |
| Request a Human Agent Advice | 244869 |
| Successful Handover | 245637 |
| Ticket Creation | 244870 |
Since each bot design and purpose is unique, there will likely be other indicators you want to consider.
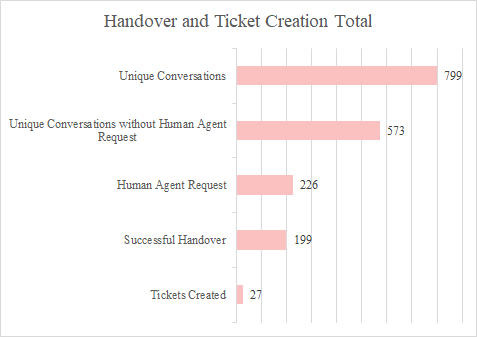
The most common totals include the sum of unique users, unique conversations, conversations with or without handover attempts, fallback occurrences, and the count of how many times the start Module has been passed, as is shown in the table below:
| Totals | Value |
| Unique Users | 480 |
| Unique Conversations | 799 |
| Human Agent Request | 226 |
| Successful Handover | 199 |
| Tickets Created | 27 |
| Conversations without Human Agent Requests | 573 |
| Fallbacks Occurred | 61 |
| Conversations without Fallbacks | 738 |
The final thing that can be added is an additional column called "Recognition".
This will evaluate the potential connection of the two Modules, meaning it checks the bot's flow to determine whether the current Module leads to the next predicted Module. This calculation is crucial for the analysis of AI recognition.
| Timestamp | Conversation / Conversation ID | Conversation / Module ID |
Conversation / Next bot module ID |
User / Certainly User ID |
Recognition |
| 11/30/2020 | 4462250 | 235946 | 244948 | 4796931 | // |
| 11/27/2020 | 4462250 | 235944 | 235946 | 4796931 | // |
| 11/27/2020 | 4462250 | 247844 | 233571 | 4790568 | Recognition Fail |
| 11/25/2020 | 4462250 | 247844 | 176802 | 4791201 | Recognition Success |
Formulas and calculations
The totals presented in Table 2 can be calculated in the following manner:
| Name | Description | Formula |
| Unique Users | Number of unique users who conversed with the bot | = COUNT(UNIQUE(User / User ID)) |
| Unique Conversations | Unique users can have multiple conversations with the bot, counts each individually | = COUNT(UNIQUE(Conversation / Conversation ID)) |
| Human Agent Request | Number of users that visited the Module responsible for contacting a human agent | = COUNTIF(Module ID, Request a Human Agent Advice Module ID) |
| Successful Handover | Number of users successfully handed over to the human agent | = COUNTIF(Module ID, Handover Successful Module ID) |
| Tickets Created | Number of users that created new ticket requests | = COUNTIF(Conversation / Module ID, Ticket Creation Module ID) |
| Conversations without Human Agent Requests | Number of unique conversations bot handled without human agent request | = Human Agent Request Total – Tickets Created Total |
| Fallbacks Occurred | Number of times fallback occurred / the Fallback Module visits | = COUNTIF(Conversation / Module ID, Fallback Global Module ID) |
| Conversations without Fallback | Number of conversations handled without the fallback | = Unique Conversations Total – Fallbacks Occurred Total |
The Recognition column evaluates the flow’s ability to go from one predicted Module to another. If the bot asks for the user’s input in the form of an open-ended question, it is expected of the bot to recognize the input and point the upcoming connection to the intended, correct Module.
In the example, we evaluated how often the bot recognizes the user’s intent of the Module “User Question Module”. If the intent was recognized, the bot should visit the appropriate Module. On the other hand, if the bot fails to recognize the intent behind the user’s input, it triggers “Fallback”.
The formula below is used for such recognition calculation:
=IF(AND(Conversation / Module ID first entry = 247844 , Conversation / Next bot module ID first entry = 233571), "Recognition Fail", IF((Conversation / Module ID first entry =247844), "Recognition Success", "//"))
First, we are creating the formula while keeping in mind the three possible outcomes of the calculation: “Recognition Fail”, “Recognition Success”, and “//”. We will return to these later.
Then, we check the condition where the Module ID of the row entry must correspond to the ID of the Module you wish to consider as the current location (in this example, the name of the current Module is “User Question Module“, and its ID 247844) and the upcoming/predicted next bot Module ID you believe the bot should go to (in this example, we seek how many times it didn't perform as intended, so we use “Fallback” Module and its ID 233571).
Once the formula reaches a cell in which the Module ID is 247844, and the Next bot Module ID is 233571, it will give a result of “Recognition Fail”.
However, if the initial condition is not fulfilled, it checks the next one where the current Module ID corresponds to 247844, but the Next bot Module ID is NOT 233571. In that case, we have a “Recognition Success”, as the connection between the current and next Module did not yield a fallback.
Finally, the last condition marks every other connection as “//” since it doesn’t contain either 247844 or 233571, meaning the connection we are searching for was not established at all.
Why Excel Pivot Table is your new best friend
Once all the values and information are gathered, it's time to create a pivot table.
To do so, go to the “Insert” tab, click “PivotTable”, select the column categories as the range, and don’t tick the box that adds this data to the Data Model. Once a Pivot Table is created, organize the Pivot Table Fields in a way you prefer by using drag-drop.
The way we combined the fields for our example is:
| Filters |
Columns |
|
Rows |
Values |
Our PivotTable setup led to the following table layout, which depicts how many times good or bad recognition connections were established in a 3-month period:
| Count of Recognition | Recognition Type | ||
| Time Period | Recognition Fail | Recognition Success | Grand Total |
| Sep | |||
|
1-Sep |
2 |
2 |
|
|
3-Sep |
1 |
1 |
|
|
4-Sep |
6 |
6 |
|
|
21-Sep |
1 |
1 |
|
|
23-Sep |
5 |
5 |
|
|
30-Sep |
1 |
1 |
|
| Oct | |||
|
7-Oct |
1 |
1 |
|
|
17-Oct |
1 |
1 |
|
|
20-Oct |
1 |
3 |
4 |
|
21-Oct |
3 |
3 |
|
|
27-Oct |
7 |
7 |
|
|
28-Oct |
1 |
1 |
|
| Nov | |||
|
3-Nov |
1 |
1 |
|
|
5-Nov |
2 |
2 |
|
|
9-Nov |
1 |
3 |
4 |
|
10-Nov |
1 |
2 |
3 |
|
12-Nov |
2 |
2 |
|
|
17-Nov |
1 |
1 |
|
|
25-Nov |
1 |
2 |
3 |
|
27-Nov |
8 |
8 |
16 |
|
30-Nov |
5 |
5 |
|
|
Grand Total |
16 |
54 |
70 |
To get a clear perspective of the recognition success-fail ratio in the occurrences, there are two ways to get those percentages.
In the first, you create a new field by dragging the “Recognition” field again into the Values section and setting its value as a “% of Rows Total” with “Recognition” as a base field. This will generate new columns holding the share of each recognition type occurrence.
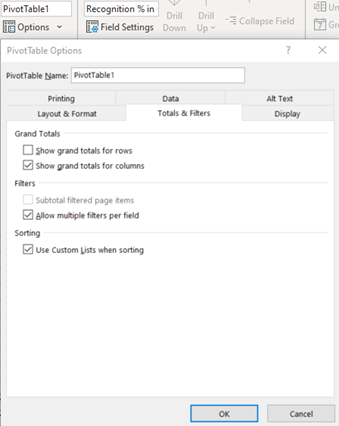
For better visibility, make sure to untick the “Show grand totals for rows” box located in the “Options” tab, as shown in the picture below.
However, if you're not that fond of in-depth PivotTable features, we highly suggest taking the other route, which we'll continue with for the rest of the article.
In this option, you copy the PivotTable that was initially created (like in Table 6) and paste it into a worksheet in the form of values. If you paste it as you usually do, the pivot functionality will stay, but in this case, we want to remove it and continue working solely on the values.
To get the % share values, you must divide the wanted recognition type by the grand total column.
Visualization
Now that you have your data ready, it's time to get creative and visualize it! Play around with the data you have, and display it in the way you find the most appealing and suitable.
For our example, we have created a combo chart with custom combinations. Here, we set the absolute values on the primary, and the relative values on the secondary axis, as shown below:
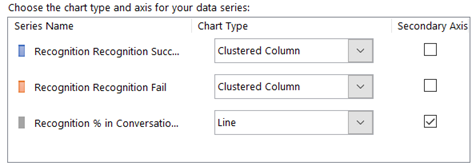
With this setting, we can show different value types on one chart without the expense of distorting and misrepresenting data.
The final result should resemble the following chart, in which we have shown a specific period of November from the dataset:
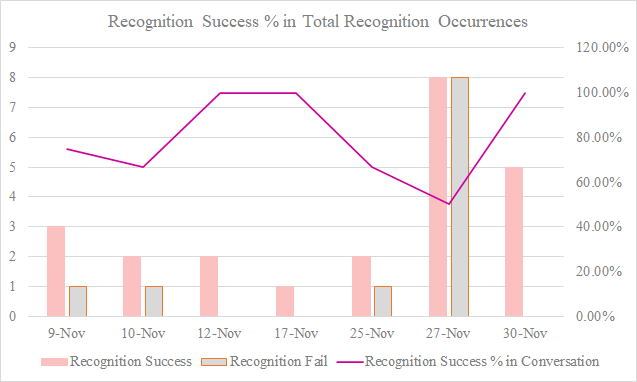
Another chart example based solely on the totals from Table 2 and calculations from Table 4 showcases the bot's ability to independently answer users' questions without human agent interference.
Both methods by which we created the final 2 charts are usable across a number of different KPIs, which are not necessarily presented here.
The PivotTable method through which we analyzed and presented the Recognition Success chart is employable on any KPI you wish to track chronologically/over time. The second chart utilizes the counting method to portray any aggregate value extracted from the specific Module ID visits.
Now it's time to take this chart, interpret it with your team, and find new, exciting ways to utilize and improve your chatbot!