Want to better understand the performance of your bot? The Traffic Report provides a valuable overview of the chatbot's traffic and any KPIs you're tracking in your bot with Tags.
To access, navigate to the drop-down Section menu and select "Reports". The Traffic Report is the current default view, with more reports planned for future iterations.
In this article, we'll cover:
- Data displayed in the Traffic Report
- Configuring your bot for the Traffic Report
- Using the Traffic Report visualizations
Data displayed in the Traffic Report
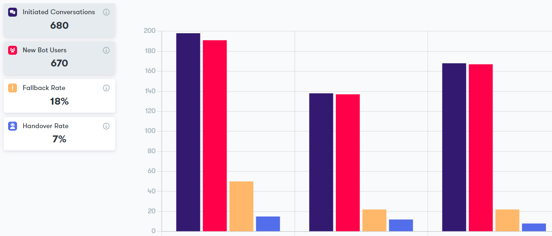
The Traffic Report displays the number of initiated conversations and new bot users as well as data specific to points where you've added Tags within your chatbot flow, such as the Fallback, Handover, and Helpful/Unhelpful Counts/Rates. Adding Tags allows us to measure the number of users that have landed on or been through particular Modules.
To see Tag-based data points in the Traffic Report, you must add the relevant Tags to your bot's Modules in the Conversation Builder. For each Tag's data to be displayed, there must be user traffic on at least one respectively tagged Module.
The column on the left side of the Traffic Report displays the following data points:
- Initiated Conversations: Total number of sessions with at least one bot user message. No Tag must be set to display this count.
- New Bot Users: Total number of users who messaged the selected bot. Users may initiate multiple conversations yet are only counted once. No Tag must be set to display this count.
- Tag Counts/Rates: Based on Tags added to Modules. Shown as absolute (count) or the percentage (rate) of initiated conversations in which a Tag occurred out of the total number of initiated conversations.
More information on the available Tag Rates can be found in the table in the next section.
Tags are only counted once per conversation, and empty conversations (in which users have not sent any messages to the bot) are excluded.
Configuring your bot for the Traffic Report
To benefit from the Traffic Report, you must ensure you've added Tags to the appropriate Modules of your chatbot. These Tags track data necessary for the Tag Counts and Tag Rate calculations.
Some Tag names are predefined by Certainly. We recommend adding these as indicated below to track data points essential to assessing your bot's value.
In the table below, we'll provide more information about the Tag Rate calculations and how to set up your bot to accurately capture the relevant data. You'll find the following:
- Tag Rate: Names of default Tag Rates visualized in the Traffic Report.
- Description: What each Tag Rate represents and how it is calculated. Calculations assume correct Tag assignment.
- Tag assignment: Which predefined Tags should be added to which Modules within the Conversation Builder.
- Example flow: Example of each Tag's placement within a conversational flow.
|
Tag Rate |
Description |
Tag assignment |
Example flow ** add Tag to Module with this bot message |
|
Completed Flow Rate |
Indicates the bot's ability to guide the user through an entire conversation flow. Number of conversations that have reached the end of a flow divided by the total number of conversations. |
Add the Completed Flow Tag to Modules where the end of a conversation flow is reached. |
User: "Can you tell me the status of order #12345?" Bot: "Sure! Order #12345 has left the warehouse and is expected to arrive on July 12, 2022." ** |
|
Conversions Rate |
Indicates the bot's ability to facilitate a conversion. Number of conversations that have resulted in a conversion divided by the total number of conversations. | Add the Conversions Tag to Modules where the point of conversion is reached. |
Bot: "Can I add that item to your cart?" User: "Yes" Bot: "Super 👍. It has been added!" ** |
|
Fallback Rate |
Indicates the bot's inability to understand the customer during a conversation. Number of conversations containing a Fallback divided by the total number of conversations. | Add the Fallback Tag to Modules where the bot reacts when it does not understand the user's input. |
User: "aqswde" Bot: "Sorry, I didn't quite get that. Can you please rephrase?" ** |
|
Handover Rate * |
Indicates the bot's inability to handle conversations independently (without third-party involvement). Number of conversations containing a Handover divided by the total number of conversations. |
Add the Handover Tag to Modules where the bot confirms the transfer of the conversation to a human agent. |
User: "I want to speak to a human." Bot: "Okay, I'll check if someone is available." ** |
|
Helpful Rate |
Indicates user-perceived helpfulness of the bot responses. Number of conversations containing bot responses to "helpful" evaluations divided by the total number of conversations. | Add the Helpful Tag to Modules where the bot responds to a user's "helpful" evaluation. |
Bot: "Did that answer your question?" User: "Yes" Bot: "Great! Happy to help 😊" ** |
|
Start Rate |
Number of conversations that have landed on Modules with the Start Tag divided by the total number of conversations. This rate is usually 100%. |
Add the Start Tag to Modules which you define as the beginning of a conversational flow. We recommend tagging all possible entry points to the bot, such as Modules following pop-up messages. |
Bot: "Hi! I'm a chatbot, and I can help answer your questions." ** |
|
Unhelpful Rate |
Indicates user-perceived unhelpfulness of the bot responses. Number of conversations containing bot responses to "unhelpful" evaluations divided by the total number of conversations. |
Add the Unhelpful Tag to Modules where the bot responds to a user's "unhelpful" evaluation. |
Bot: "Did that answer your question?" User: "No" Bot: "Sorry. Let me offer some other options." ** |
|
Webhook Rate |
Number of conversations that have triggered a Module with a Webhook Tag divided by the total number of conversations. |
Add the Webhook Tag to Modules that contain a Webhook. |
Bot: "Thanks for filling that out! I'll email your message and contact info to an agent." ** (Certainly Dynamic Email Notification WH instance triggered in Module Connections) |
* Some bot setups distinguish between explicit and implicit handover. In those cases, the default Handover Rate of the Traffic Report will not include both handover values.
For instance, in bots set up for the KPI Relationship Report (legacy), the Handover Tag tracks explicit handover, and Tag 13 tracks implicit handover. For those bots, the Handover Rate will only reflect explicit handovers, and Tag 13 must be added to the Traffic Report data display to view the implicit handover rate.
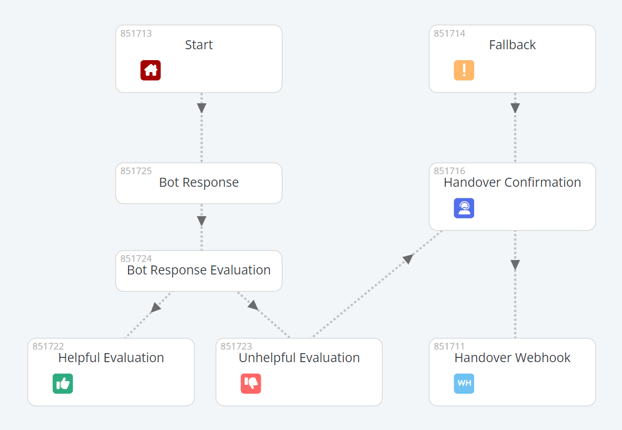
Here, you can see a simplified setup containing several of the Tags noted in the table above:
We expect to refine future iterations of the Traffic Report based on customer needs. Contact us if you want to learn more or need help with the bot configuration!
Using the Traffic Report visualizations
In this section, we'll explore the various ways you can edit the display of the Traffic Report.
Please note that while the Traffic Report is refreshed following each request, live traffic is not displayed immediately upon occurrence. Interactions between a bot and a bot visitor will be reflected after approximately 15-30 minutes.
- Select your bot and timeframe: At the top of the page, select the bot you'd like to visualize the performance of. Then use the date selector to set the timeframe of the data you want to be displayed.

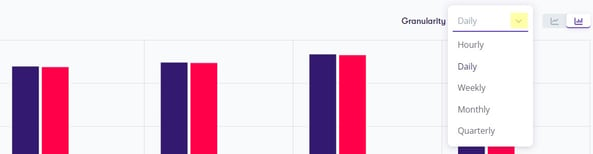
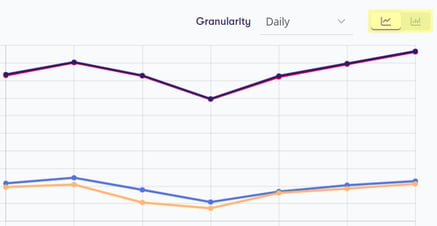
- Set the display granularity: Choose your preferred display from the Granularity drop-down selector in the upper right corner of the visualization. Please note that the data is provided in UTC time.
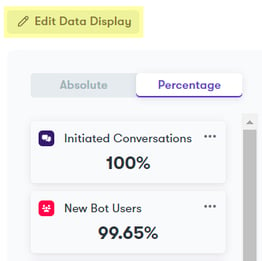
- Edit the data display: Change which Tag Counts/Rates are shown in the visualization by selecting "Edit Data Display" above the column on the left.
Choose your desired Tags from the drop-down selectors.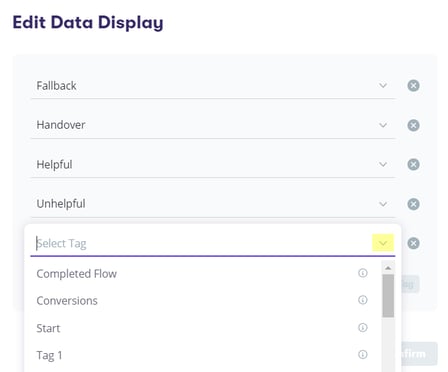
Remove any Tags you don't want to be displayed by selecting the "X" symbol to the right of the Tag name. Add new Tags by selecting "Add Tag" on the right side of the modal window. When you've finished, select "Confirm" to return to the Traffic Report.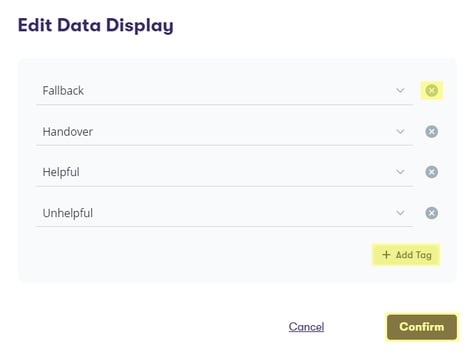
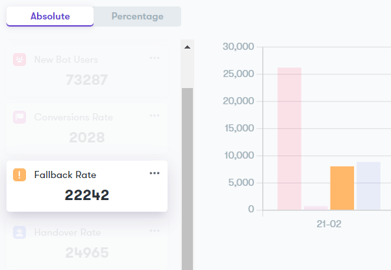
- Display results in absolute or percentage form: Use the tabs at the top of the left column to select whether the data is presented as an absolute (count) or a percentage (rate).
.jpg?width=391&height=268&name=TRAbsolutePercentage%20(1).jpg)
- View chart in line or bar form: To change the type of chart, use the tabs in the upper right corner of the visualization. Select the left tab to display your data in a line chart, or choose the right tab for a bar chart.
- Highlight specific data points: When you select any of the data points in the left column (Initiated Conversations, New Bot Users, or Tag Counts/Rates), all other data points in the visualization become more transparent to emphasize the selected data. To remove the emphasis, simply select the data point again.
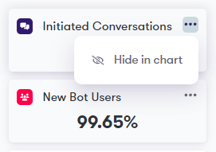
- Hide data points: If you wish to exclude a data point from the visualization, select the horizontal three-dot menu for that data point, then choose "Hide in chart". To display the data point again, simply repeat the process, this time selecting "Show in chart".
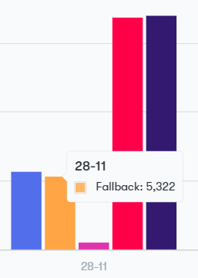
- Get more data on particular periods: To view more detailed information about a specific section of time within the display, hover over the relevant chart bar or line.
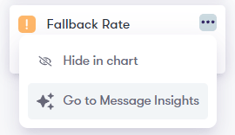
- Navigate to the Message Insights data for a Tag Count/Rate: To view the relevant Message Insights data for a particular Tag Count/Rate in the left column, select the horizontal three-dot menu for that data point, then choose "Go to Message Insights".
It is possible for the data display values to be null (thus, not reflected in the chart).
Conversations, Bot Users, and Tag data can be null if the bot hasn't been published or had any traffic in production. Tag data can also be null if no conversations have landed on any Module with that Tag or a given Tag hasn't been assigned to a Module.